
The dashboard
The dashboard is the first page after you sign in. It gives a quick view of trading for the period you choose.
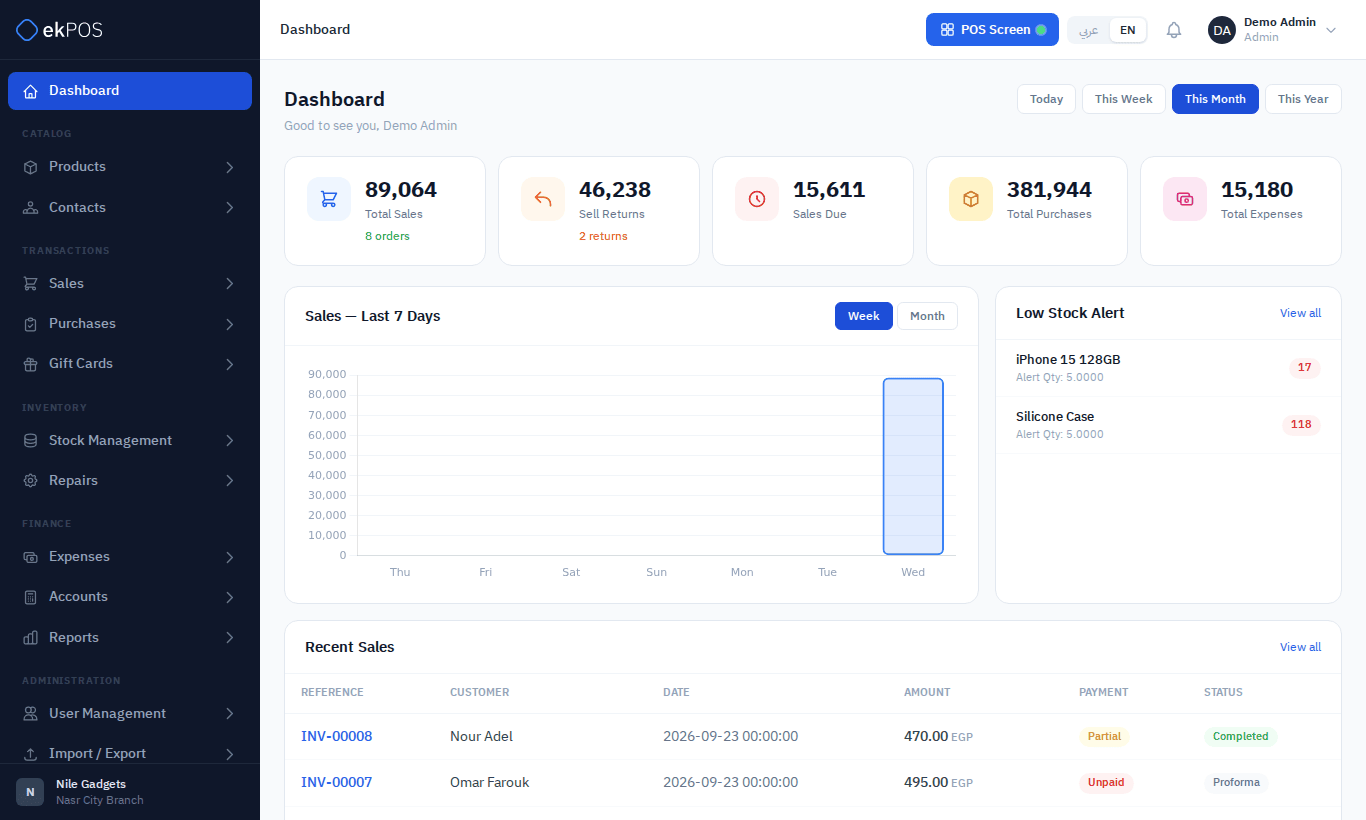
Choose the period at the top right: Today, This Week, This Month (the default) or This Financial Year. The financial year starts in the month selected in Business Settings.
Every card, the chart, Low Stock and Recent Sales cover the same locations, named under the greeting. An admin sees all locations. Anyone else sees their home location and the locations they are assigned to on their user.
The figures need the Dashboard → View permission. Without it the dashboard still opens after you sign in, but shows only a note to choose where to start from the menu.
The cards
| Card | Shows |
|---|---|
| Total Sales | The value and number of sales in the period |
| Sell Returns | The value and number of sales returns in the period |
| Sales Due | What customers still owe on sales, across all time |
| Total Purchases | The value of purchases in the period |
| Total Expenses | Expenses in the period |
NoteThe sales figures count every sale that isn't cancelled — including drafts, quotations and proforma invoices — so they can be higher than your takings. Use the Sales report with status Completed for exact figures.
Sales chart
Sales per day for the last 7 days (Week) or the current month (Month).
Low Stock Alert
Products whose total stock across those locations is at or below their Low Stock Alert Quantity, or is used up, lowest first — the same test as the Stock report's Low Stock and Out of Stock. A variable product counts the stock of all its variants. View all opens the Restock report.
Recent Sales
The latest eight sales with customer, date, amount, payment and status. Click a reference to open it; View all goes to All Sales.