
Financial reports
Profit and loss
Reports → Profit / Loss shows revenue, costs and profit for a period, with four tabs: Summary, Revenue Breakdown (by product category), Cost Breakdown (purchases by category and operating expenses by expense category) and Transactions (every sale, return, purchase and expense in the period, with a running total).
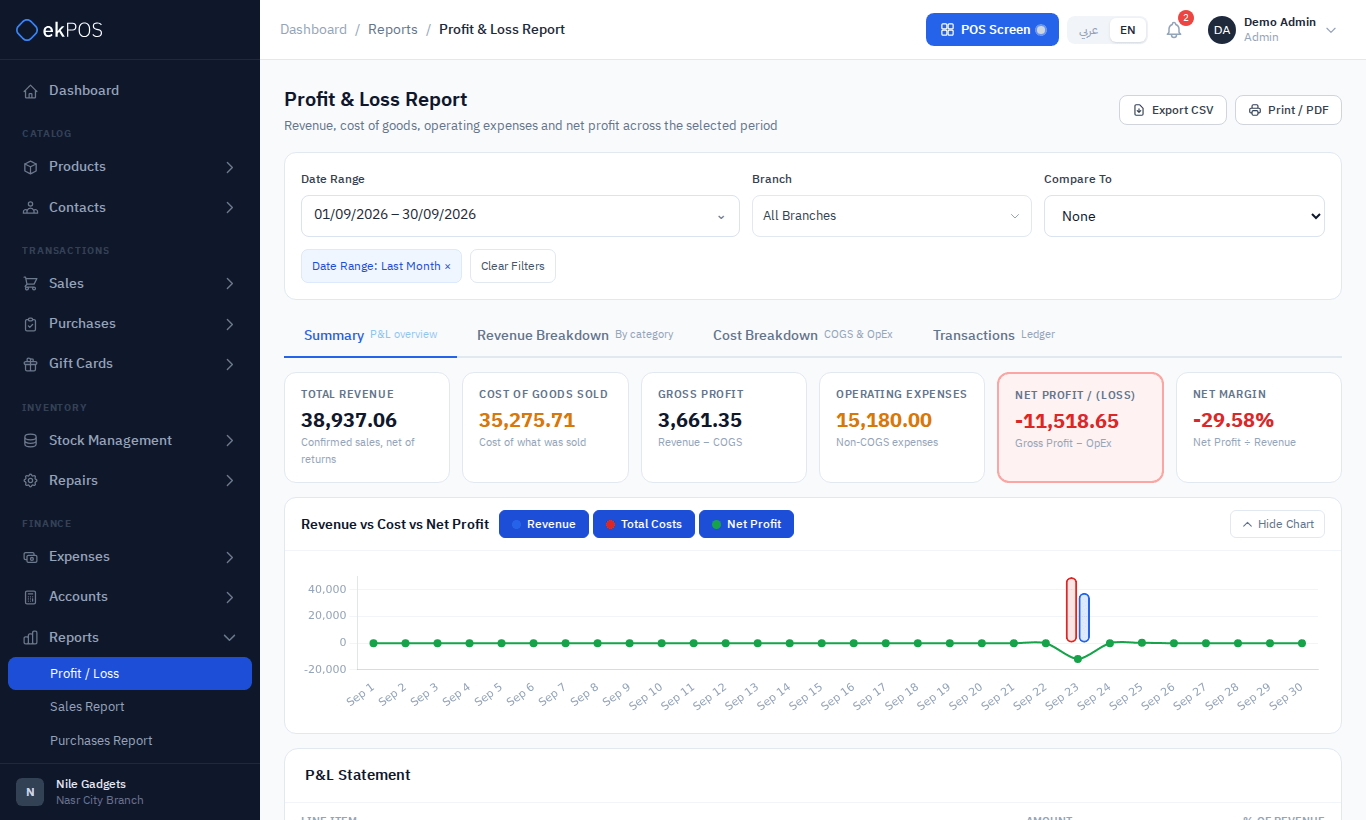
Filters: date range, branch, and Compare to the previous period or the same period last year, which adds change figures to the cards. A custom date range covers at most ten years; a longer one starts ten years before its end date, and the report says so.
How the figures are worked out. Every amount excludes VAT, which you collect and pay on and which is not income — it is reported in the Tax report. A tax-inclusive sale counts at its price less the VAT in it, and returning it takes off the same amount.
| Figure | Calculation |
|---|---|
| Total Revenue | Completed sales, less invoice discounts, less returns — all excluding VAT |
| Cost of Goods Sold | The cost of the goods sold in the period, less goods returned, plus stock written off in stock adjustments and parts used on warranty repairs — taken from your accounts |
| Gross Profit | Revenue − Cost of Goods Sold |
| Operating Expenses | Approved and paid expenses |
| Net Profit / (Loss) | Gross Profit − Operating Expenses |
| Net Margin | Net Profit ÷ Revenue |
Buying stock is not a cost: a purchase puts goods on the shelf, and they become a cost when they are sold, written off or used on a repair. Each sale is costed at the product's purchase price on the day it was made.
On the Cost tab, the product categories show the goods sold at their current purchase price; a Cost changes since sale and other entries line makes up any difference, so the rows add up to the headline figure. Inventory Shrinkage and Warranty Repair Costs have lines of their own. On the Transactions tab each sale, return, adjustment or warranty repair appears with its cost, linked to the document.
With a branch filter, cost is counted by the branch of the document it came from; entries added by hand in the accounts, which have no branch, count only when no branch is chosen.
Tax report
Reports → Tax Report is for preparing your VAT return and checking what was reported to ETA.
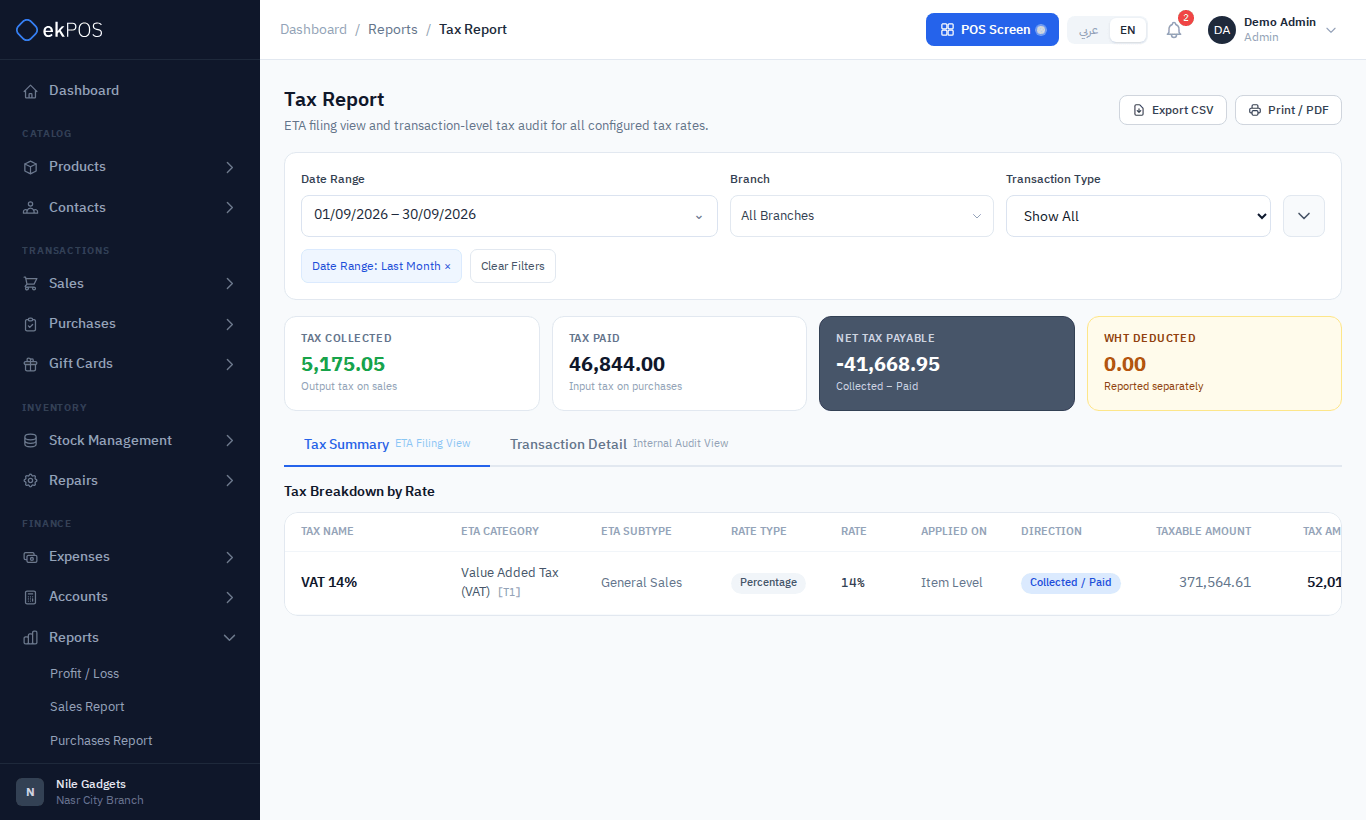
Filters: date range, branch, tax rate, transaction type (sales, purchases) and ETA category (T1–T20).
The cards show Tax Collected (output tax on final sales, less tax refunded on returns), Tax Paid (input tax on purchases), Net Tax Payable (collected − paid) and WHT Deducted. The tabs are:
- Tax Summary — each tax rate with its ETA category and subtype, rate, where it applies, taxable amount, tax and number of transactions.
- ETA Filing View — the figures grouped the way ETA asks for them.
- Transaction Detail — every taxed transaction. Returns are listed with the tax refunded as a negative amount.
Drafts, quotations and proforma invoices are left out: nobody has been charged for them yet.
- Internal Audit View — for checking the figures against each other.
Expense report
Reports → Expense Report analyses spending, with three tabs:
- Expense Summary — by category, with the share of the total and the change from the previous period.
- Transaction Detail — every expense line.
- Petty Cash Report — the petty cash fund's movements.
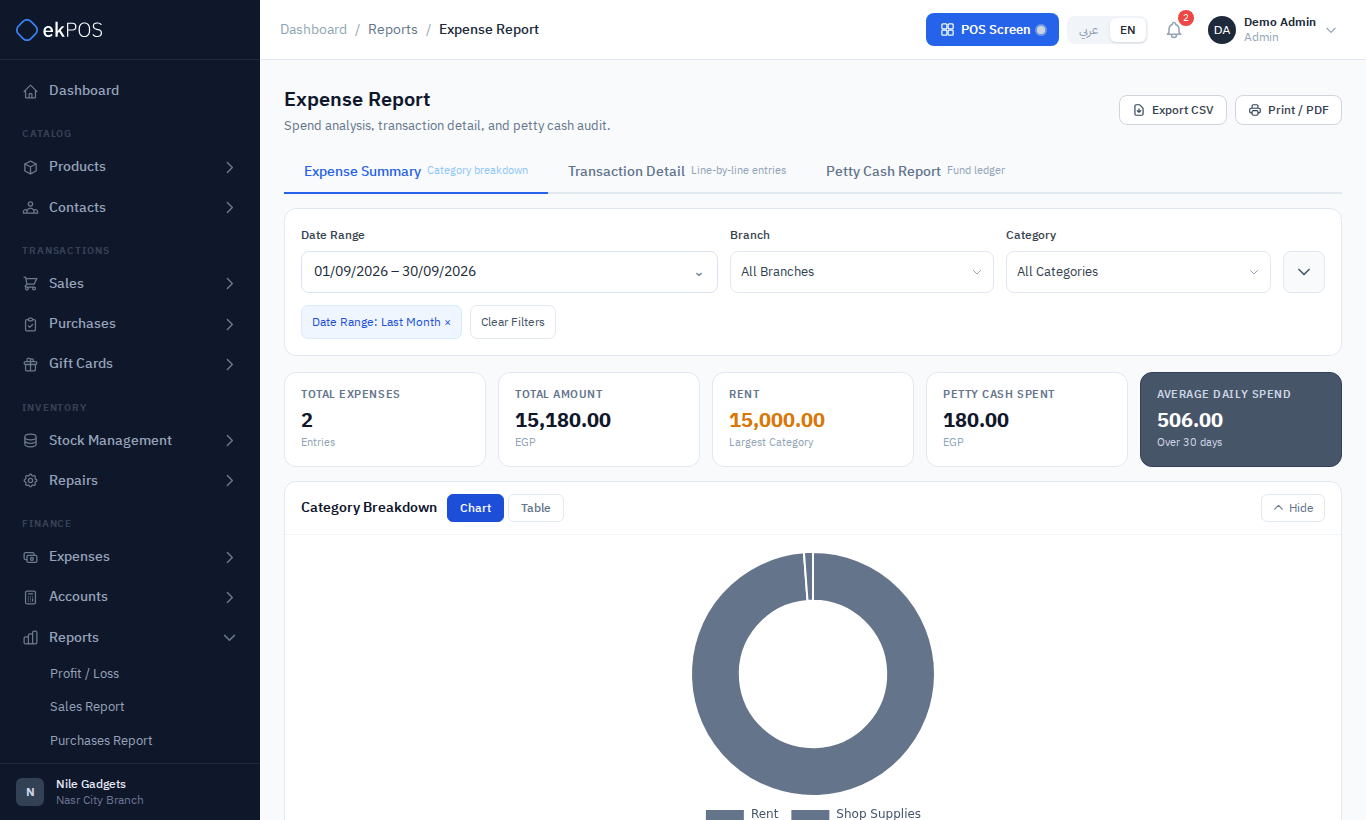
Filters: date range, branch, category, payment method and who created it. The cards show the number and total of expenses, the largest category, petty cash spent and the average daily spend.